Last updated 21/11/2019.
What are overviews
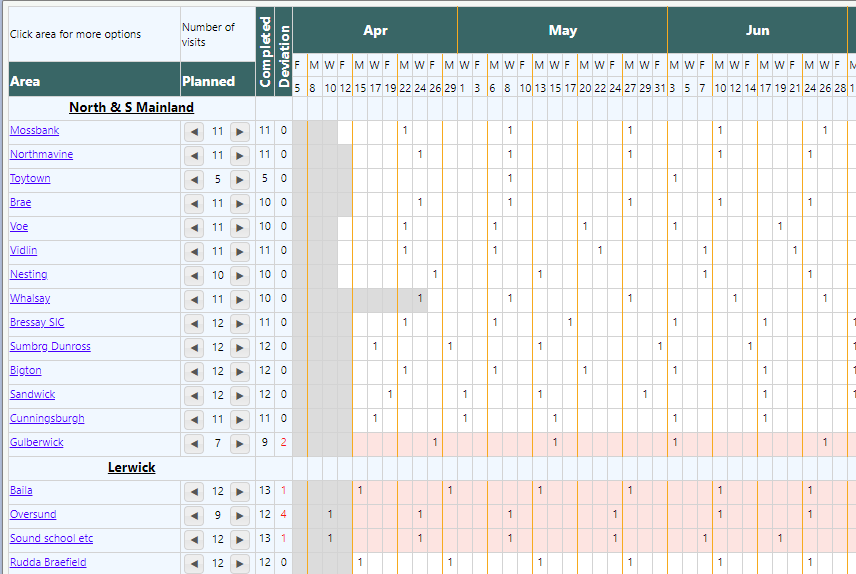
Overviews are designed to give you and your clients an at-a-glance graphical projection and summary of progress. An overview is a calendar type graph where each row represents an area in which you carry out tasks and each column is a date. Dates in the past where an area has been completed will be marked with a ‘1’ on the overview. ‘Projected dates’ are used to indicate dates where you plan to visit each area in the future and will be marked with a ‘0’.

Overviews can help you decide which areas need to be visited next. They can also be accessed by any customer with Groundleader login access to let them know when you should next be in their area. Overviews can have permission levels set restricting who can view them.
Overviews are meant to be a rough guide for your staff and customers, visit and projected dates shown do not need to be exact. Only the days Monday, Wednesday and Friday are represented on the overview. This is done to save space and give the user a bit of flexibility, “It will be done at the start/middle/end of the week”.
Guide tasks
Before you can create an overview you will need to ensure that you have some of your tasks set up as ‘Guide tasks’.
Guide tasks are used to represent the area that they are in. Each row in an overview represents an area which is in turn represented by a guide task. When a visit is logged for a guide task the area it represents on any overview will be marked as having been visited on that date. To make a task into a guide task it must have its ‘Make this a guide task’ option checked and a ‘Label for overview’ entered. See the tasks resources page for more information on setting up and editing your tasks.

Setting a task to be a guide task on the add/edit task form.
The tasks ‘Label for overview’ is what is shown as the area name when that task is used in an overview. A guide task will be required for each row you wish to show on an overview.
For example, we have 20 grasscutting tasks in the village of Golspie that usually get carried out over the course of a day or two. If we wanted to show Golspie as an area on our overview we’d make one of those 20 tasks into a guide task and give it the guide name (label for overview) ‘Golspie’. It does not really matter which of the 20 tasks is chosen to be the guide task but we may want to pick one that is usually done last to more accurately represent when the area is finished.
Create an overview
One you have all the areas you want to include in your overview represented by guide tasks the overview can be created. Select the ‘Overviews’ option from the ‘Schedules’ section of the main menu to get to the overviews page.
This page will list any existing overviews you have set up. To create a new one click the ‘Add new overview’ button.
Overview ID
Enter a unique name for the overview.
Visible to
Select who you want to be able to view this overview. Customers will need to have been set up so they can log in to Groundleader before they can view any overviews.
- Staff only, only your staff will be able to view this overview.
- All staff and customers, all your staff and all customers who can log in to Groundleader will be able to view this overview
- All staff and selected customers. With this option you will need to select which customers get to see the overview one at a time by clicking the ‘select customer’ link. Customers who can view the overview will be listed on the page, click the ‘X’ next to a customer name to remove them from the list.
Start and end date
Enter the date range which you want the overview to cover, usually this will be the earliest date to the latest date any included area will be visited. It might be an idea to add a few days or weeks to the start and end of the overview for if any visits occur outwith the tasks normal start and finish time.
Auto adjust projected
When you log a visit for a guide task the area it represents on any overview is marked as having been completed on that date. If the visit was a bit earlier or later than expected you may need to adjust your next projected visit dates to make up for the change.
For example, a visit for a fortnightly task is carried out a week late. The next projected visit date is now only a week in the future, you may need to push that to a later date, maybe even the one after it as well.
Setting the ‘auto adjust projected’ option will automatically even out the time between the next few projected visits shown on the overview each time a visit for a guide task is logged. This prevents you having to constantly update the projected dates on your overviews as the season progresses.
This option can be set individually for each task in the overview once they have been added.
Select guide tasks
This is where you choose which guide tasks to include in the overview. Guide tasks are added to the overview by group. The overview will separate the guide tasks it contains by group. If a name has been set for a group it will be shown above the groups tasks, if not an empty row will be used to separate it from the group above.
Within each group the guide tasks (areas) will be ordered by their geographical location as dictated by the tasks site.
To add a group of tasks to the overview click the ‘add group’ link. Here you will need to enter the group name as you would like it to be shown on the overview. If the overview is only going to contain one group of tasks the group name will not be shown.
You will also need to select which guide tasks to include in the group. All your guide tasks are listed in the left list by their guide name (Label for overview). If there are a lot of guide tasks the list can be filtered by contact ID or the team to which they are assigned.
Click a guide task in the left list to add it to the current group. Click a guide task in the right list to remove it from the group. Click the confirm button when you are happy with your group. As you add groups to the overview they will be shown on the form.
To add more groups to the overview click the ‘add group’ link again. Guide tasks can only be added once per overview and will be greyed out in the left list if they are already in another group.

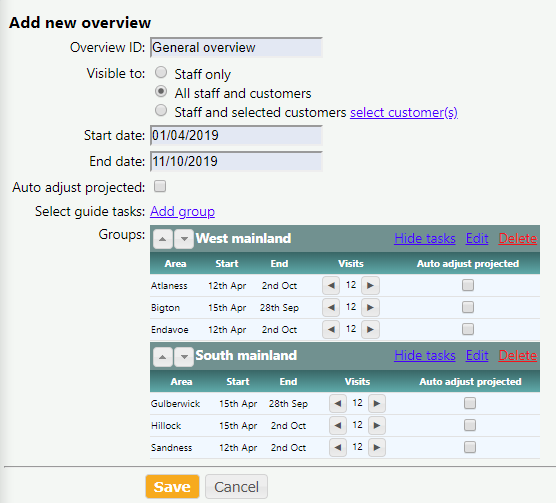
Creating an overview with two groups each containing three guide task areas.
Use the up and down arrow buttons next to the group name to change the order in which the groups appear on the overview. The edit link allows you to edit the group, click delete to remove the group from the overview.
Each guide task will be shown with its start and finish date. The number of visits to be carried out for that task each year is also shown. You can use the arrow buttons to adjust this value for the purpose of the overview only, the task itself will not be updated. The ‘Auto adjust projected’ setting can be set for each task individually.
When you are happy with all the tasks in your overview click the save button.
To edit an existing overview find it in the list of existing overviews on the overviews page and click its ‘edit’ button. To delete an overview, after clicking ‘edit’, click ‘delete’.
Viewing an overview
To view an overview find it in the list on the overviews page and click its ‘view overview’ link.
When an overview is created Groundleader will check if any of the included guide tasks have had visits logged since the overview start date. If so it will mark a ‘1’ in each overview ‘cell’ to indicate that the area was completed around that date. If the overview start date has not yet passed you will be presented with a blank overview.

The column highlighted in green indicates the current date. Greyed out cells indicate dates that fall outside the guide tasks start and finish dates.
Each row is highlighted in red as for each task the total number of actual visits and projected visits do not add up to the tasks required number of visits. This is because we have not yet added any projected visits to the overview.
Projected visits
Projected visits are used to give an indication of when you to plan to visit each area in the future. They can be added manually one at a time to the overview or by using the automatic function.
To add a projected visit manually to the overview click in the cell that represents the date you plan to visit the area and Groundleader will mark it with a ‘0’. To remove a projected visit click it again. Projected visits cannot be set on dates in the past.
To use the automatic function to fill your projected visit dates click the ‘Automatically fill all projected visits’ link above the overview. This will automatically fill in projected dates for your overview. It is intended for use when first setting up an overview but can be used at anytime. Be aware of the following before confirming this action:
- Groundleader may be good but it can’t guess the order in which you want to carry out your visits. For the autofill of the overview to work make sure each area has either at least one actual visit logged or one projected visit already set.
- Any existing projected visits after the first one for each task will be removed. If the first projected visit is in the past it will be moved to the current date.
- Groundleader will project your planned number of visits for each area on the overview taking into account any actual or projected visits already set.
- The final visit for each area will not be projected beyond the tasks finish date regardless of the overviews finish date.
Click the ‘Confirm button to fill out the planned visit dates on your overview. If there are any issues preventing the automatic function from working you will receive a message stating why.

Adjusting visit dates
To indicate that an area was visited on a date in the past where no visit has been logged in Groundleader click the appropriate empty cell in the planner then the ‘mark as visit’ option. Actual visit dates can only be set in the past or on the current date. Adding a visit date in this way will not log an actual billable visit, you should log that separately.
Clicking on an existing visit date in the overview will give you two options.
- Remove visit, click this to remove the visit from the overview.
- Move visit, click this if the visit is on the wrong date, you will then need to click the cell that represents the correct visit date.
Task options
Clicking on the guide task name will bring up two options.
- View task details, this will take you to the task details page for the selected guide task.
- Even out the next projected visits. This will even out the time between the next few projected visits for this area. Select how many visits you want to adjust.
- Make projected dates into fixed visit dates. This option is only shown if the guide task is of the ‘Fixed’ schedule type. Selecting this option will replace any fixed visit dates set for this task with new ones using its projected visit dates on this overview. See the fixed schedule help page for more information on how to set up fixed visit dates.
The next column shows the planned number of visits for each area, this can be adjusted by using the arrow buttons. Adjusting this will only affect the current overview, the task details will not be changed.
The completed column shows the number of visits that have been recorded for the task in the current overview. The deviation column shows the difference between the planned number of visits and projected + actual visits. A value of -1 would indicate that you need to add one more projected visit for the task, a positive value indicates to many visits for the task.
Download as spreadsheet
To Download the currently displayed overview as a spreadsheet click the ‘Download as spreadsheet’ link above the overview.
Editing & deleting visits
If a visit for a guide task is deleted via the ‘Search visits’ page, that visit will also be removed from any overview that contains the task.
If a visit for a guide task is edited and the visit date is changed, where that visit is shown on any overview will also be moved to the new date.
Use overview the following year
At the end of each season, if you want to use the same overview again next year, just edit it and add one year to its start and finish dates. Doing this will remove all the previous projected visits dates, new ones will need to be added each year.
Customer access
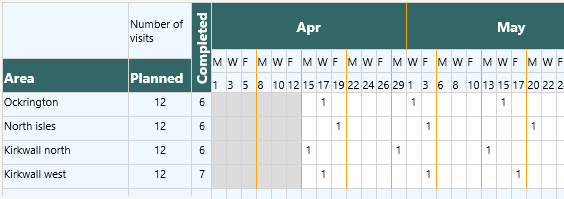
When a customer views an overview via the customer login area they cannot make any changes to it. The customer cannot adjust the number of visits for each task and they do not see the deviation column. Clicking on individual cells has no effect when done by a customer.

An overview as seen by a customer.
